
Complex Excel spreadsheets may impose a significant risk to completeness and accuracy of the data processed with them. Complex formulas, pivot tables, and lots of external references increase the possibility of human errors, as already a small error such as a wrong VLOOKUP offset or even just a misplaced SUM cell range are both hard to catch and may cause significant errors. Additionally, the fraud potential increases as well, as fraudulent manipulations can be hidden more easily in complex spreadsheets than in simple ones.
There are whole organizations dealing with spreadsheet risks, as e.g. the EuSpRIG (European Spreadsheet Risks Interest Group), where significant effort is put into spreadsheet complexity and risk evaluation.
XLscore is an Excel risk scoring tool built to order for Graser Consulting GmbH with simplicity of use in mind. It can be used to evaluate the complexity of an Excel spreadsheet and thus its susceptibility to human errors or fraud. It does this by assigning risk scores to formula complexity, external references, or pivot tables, and calculates a total risk score of spreadsheets. Additionally, errors contained in the spreadsheet are counted and categorized, and the absolute sum of all numbers is calculated and displayed. The results are displayed in a textual format, but may be saved as a CSV or XLSX file as well.
Methodology
The weighted risk scoring is based on an article by Bing Chien Quek, Sydney,
Spreadsheet Complexity, published in the July 2012 issue #44 of the CompAct newsletters by the Technology Section of the Society of Actuaries (SOA). Basically, an individual weight is assigned to each formula operator or function, and all weights over all formulas in all worksheets are summed up. Besides that numerous other characteristics of the spreadsheet are analyzed, like number of pivot tables or external references, as well as unique formula counts and statistics. Thus a number of quantitative measures is calculated that can be used to quantitatively judge the risk a specific Excel spreadsheet poses to the control target.
Usage
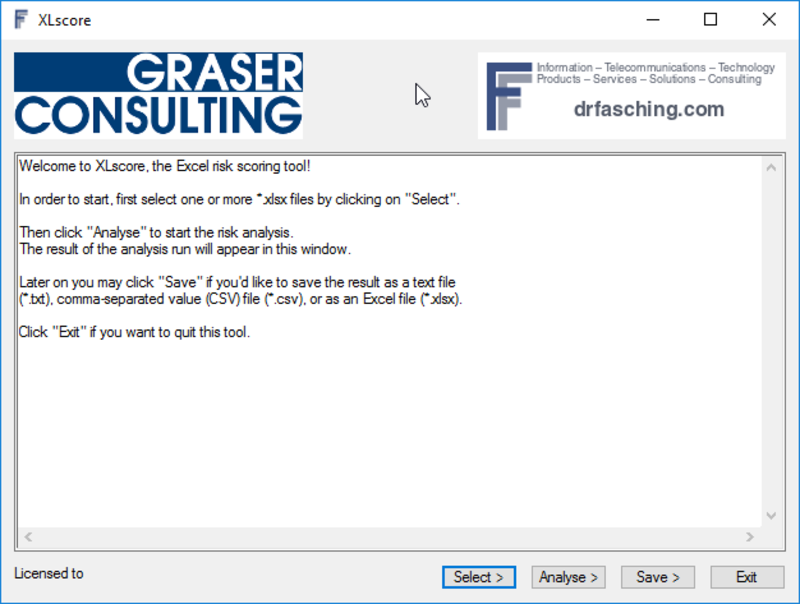
In order to start, first select one or more *.xlsx files by clicking on “Select”.
Then click “Analyse” to start the risk analysis.
The result of the analysis run will appear in this window.
Later on, you may click “Save” if you’d like to save the result as a text file
(*.txt), comma-separated value (CSV) file (*.csv), or as an Excel file (*.xlsx).
Click “Exit” if you want to quit this tool.
Result files
You may save XLscore results in either text (*.txt), CSV (comma-separated value), or XLSX (Excel OpenDocument *.xlsx files).
Text output files are just a copy of the anaylsis results displayed on screen in the XLscore result window, saved in a text (*.txt) file.
CSV and XLSX files save the results in a table format, where each analysed Excel file (workbook) occupies one row of the result file.
The columns (fields) of the result file have the following meaning:
- File — The file name of the workbook currently under consideration.
- Worksheets — The number of worksheets contained in the workbook.
- Pivot tables — The number of pivot tables contained in the workbook.
- External references — The number of external tables the workbook refers to.
- External reference files — A list of the names of the externally referenced files.
- Risk score — The total risk score of the workbook under consideration.
- Risk classification — The classification of the risk score; either HIGH (greater or equal to 1000), or LOW (below 1000).
- Formulas — The number of individual formulas contained in the workbook.
- Average risk score per formula — The average risk score of the formulas contained in the workbook.
- Unique formulas — The number of formulas that are unique, i.e. exhibit the same structure. This means e.g. that a formula that is copied down a column many times is just counted as one unique formula in this context.
- Average risk score per unique formula — The average risk score of a unique formula as described above.
- Highest score formula — The structure of the formula with the highest risk score in the whole workbook.
- Highest score — The risk score of the highest score formula contained in the whole workbook.
- Longest formula — The structure of the longest formula contained in the whole workbook.
- Longest formula length — The length in characters of the longest formula contained in the workbook.
- Most used formula — The structure of the formula with the highest occurrence frequency in the workbook.
- Most used formula frequency — The occurrence count of the most used formula above.
- Absolute sum — The sum of the absolutes of all numeric fields in the workbook, both fixed value and formula results.
- Formula sum — The sum of the absolutes of all numeric formula results in the workbook.
- Fixed sum — The sum of the absolutes of all fixed-value numeric fields in the workbook.
- Fixed value cells — The number of all cells in the workbook that contain a fixed value.
- Total errors — The total number errors (erroneous formulae) contained in the workbook.
- Errors:REF — The total number of REF (reference) errors contained in the workbook.
- Errors:VALUE — The total number of VALUE (invalid value) errors contained in the workbook.
A final row named TOTAL placed at the end of the result table contains total sums of all of the above fields over all workbooks analysed in the current XLscore run.
Support
If you are an XLscore licensee and have questions regarding its usage, you may write to
support@drfasching.com.
Licensing
If you are interested in acquiring an XLscore license, please contact sales@drfasching.com.